Cassandra Compaction Throughput Performance Explained
This is the second post in my series on improving node density and lowering costs with Apache Cassandra. In the previous post, I examined how streaming performance impacts node density and operational costs. In this post, I’ll focus on compaction throughput, and a recent optimization in Cassandra 5.0.4 that significantly improves it, CASSANDRA-15452.
This post assumes some familiarity with Apache Cassandra storage engine fundamentals. The documentation has a nice section covering the storage engine if you’d like to brush up before reading this post.
The Compaction Bottleneck
Compaction in Cassandra is the process of merging multiple SSTables and writing out new ones, discarding tombstones, resolving overwrites, and generally organizing data for efficient reads. It’s an I/O intensive background operation that directly competes with foreground operations for system resources. In a later post I’ll look at how compaction strategies impact node density, but for now, I’ll just focus on throughput.
Why Compaction Throughput Matters for Node Density
As we continue to increase the amount of data we store per node, compaction performance becomes increasingly important. It affects:
- How quickly the system can reclaim disk space
- Whether the cluster can keep up with incoming writes
- Read latency, minimizing SSTables per read
- How fast nodes are able to join a new cluster
Simply put: as your data volume and write throughput increase, compaction throughput must as well. If it doesn’t, you’ll hit a performance wall that effectively caps your maximum practical node density.
Despite the significant improvements to compaction throughput over the years, there are some circumstances where compaction performance is inadequate. Let’s take a look at the reason why, then dive into what can be done about it.
Where is the time spent?
When doing any performance evaluation, it’s important to understand how to measure where your time is spent. A lot of folks make incorrect assumptions, and then waste a lot of time trying to optimize something that doesn’t matter. I’ve written several posts about how useful profiling with the async-profiler can be from an application perspective. For looking at the OS and hardware, the eBPF based toolkit bcc-tools can help you identify process bottlenecks. I’ve used these tools extensively over the years, and in this post I’ll show how they’ve helped identify two major performance bottlenecks in compaction. My easy-cass-lab software includes all these tools, as well as integration with AxonOps for Cassandra dashboards and operational tooling.
Being 10x Smarter With Our Disk Access
When investigating compaction behavior, I discovered an major inefficiency in how Cassandra was accessing disk. The problem was especially severe in cloud environments with disaggregated storage like AWS EBS, where IOPS (Input/Output Operations Per Second) are both limited and expensive when used improperly.
When Cassandra would read in data during compaction, it would read individual compressed chunks off disk, one small read at a time. Using bcc-tools, we can monitor every filesystem operation. Here I’m using xfsslower to record every read operation on the filesystem (original headers back in for clarity):
$ sudo /usr/share/bcc/tools/xfsslower 0 -p 26988 | awk '$4 == "R" { print $0 }'
Tracing XFS operations
TIME     COMM           PID    T BYTES   OFF_KB   LAT(ms) FILENAME
22:27:38 CompactionExec 26988  R 4096    0           0.01 nb-7-big-Statistics.db
22:27:38 CompactionExec 26988  R 4096    4           0.00 nb-7-big-Statistics.db
22:27:38 CompactionExec 26988  R 2062    8           0.00 nb-7-big-Statistics.db
22:27:38 CompactionExec 26988  R 14907   0           0.01 nb-7-big-Data.db
22:27:38 CompactionExec 26988  R 14924   14          0.01 nb-7-big-Data.db
22:27:38 CompactionExec 26988  R 14896   29          0.01 nb-7-big-Data.db
22:27:38 CompactionExec 26988  R 14844   43          0.01 nb-7-big-Data.db
22:27:38 CompactionExec 26988  R 14923   58          0.01 nb-7-big-Data.db
22:27:38 CompactionExec 26988  R 14931   72          0.01 nb-7-big-Data.db
22:27:38 CompactionExec 26988  R 14905   87          0.01 nb-7-big-Data.db
22:27:38 CompactionExec 26988  R 14891   101         0.01 nb-7-big-Data.db
22:27:38 CompactionExec 26988  R 14919   116         0.01 nb-7-big-Data.db
22:27:38 CompactionExec 26988  R 14965   130         0.01 nb-7-big-Data.db
22:27:38 CompactionExec 26988  R 14918   145         0.01 nb-7-big-Data.db
22:27:38 CompactionExec 26988  R 14930   160         0.01 nb-7-big-Data.db
The above is showing we’re reading about 14KB at a time. That’s the size of the compressed page. This pattern is terrible for performance on cloud storage systems like EBS, where:
- Each read operation, no matter how small, counts against your provisioned IOPS
- Small reads waste IOPS quota while delivering minimal data
- You pay for IOPS allocation whether you use it efficiently or not
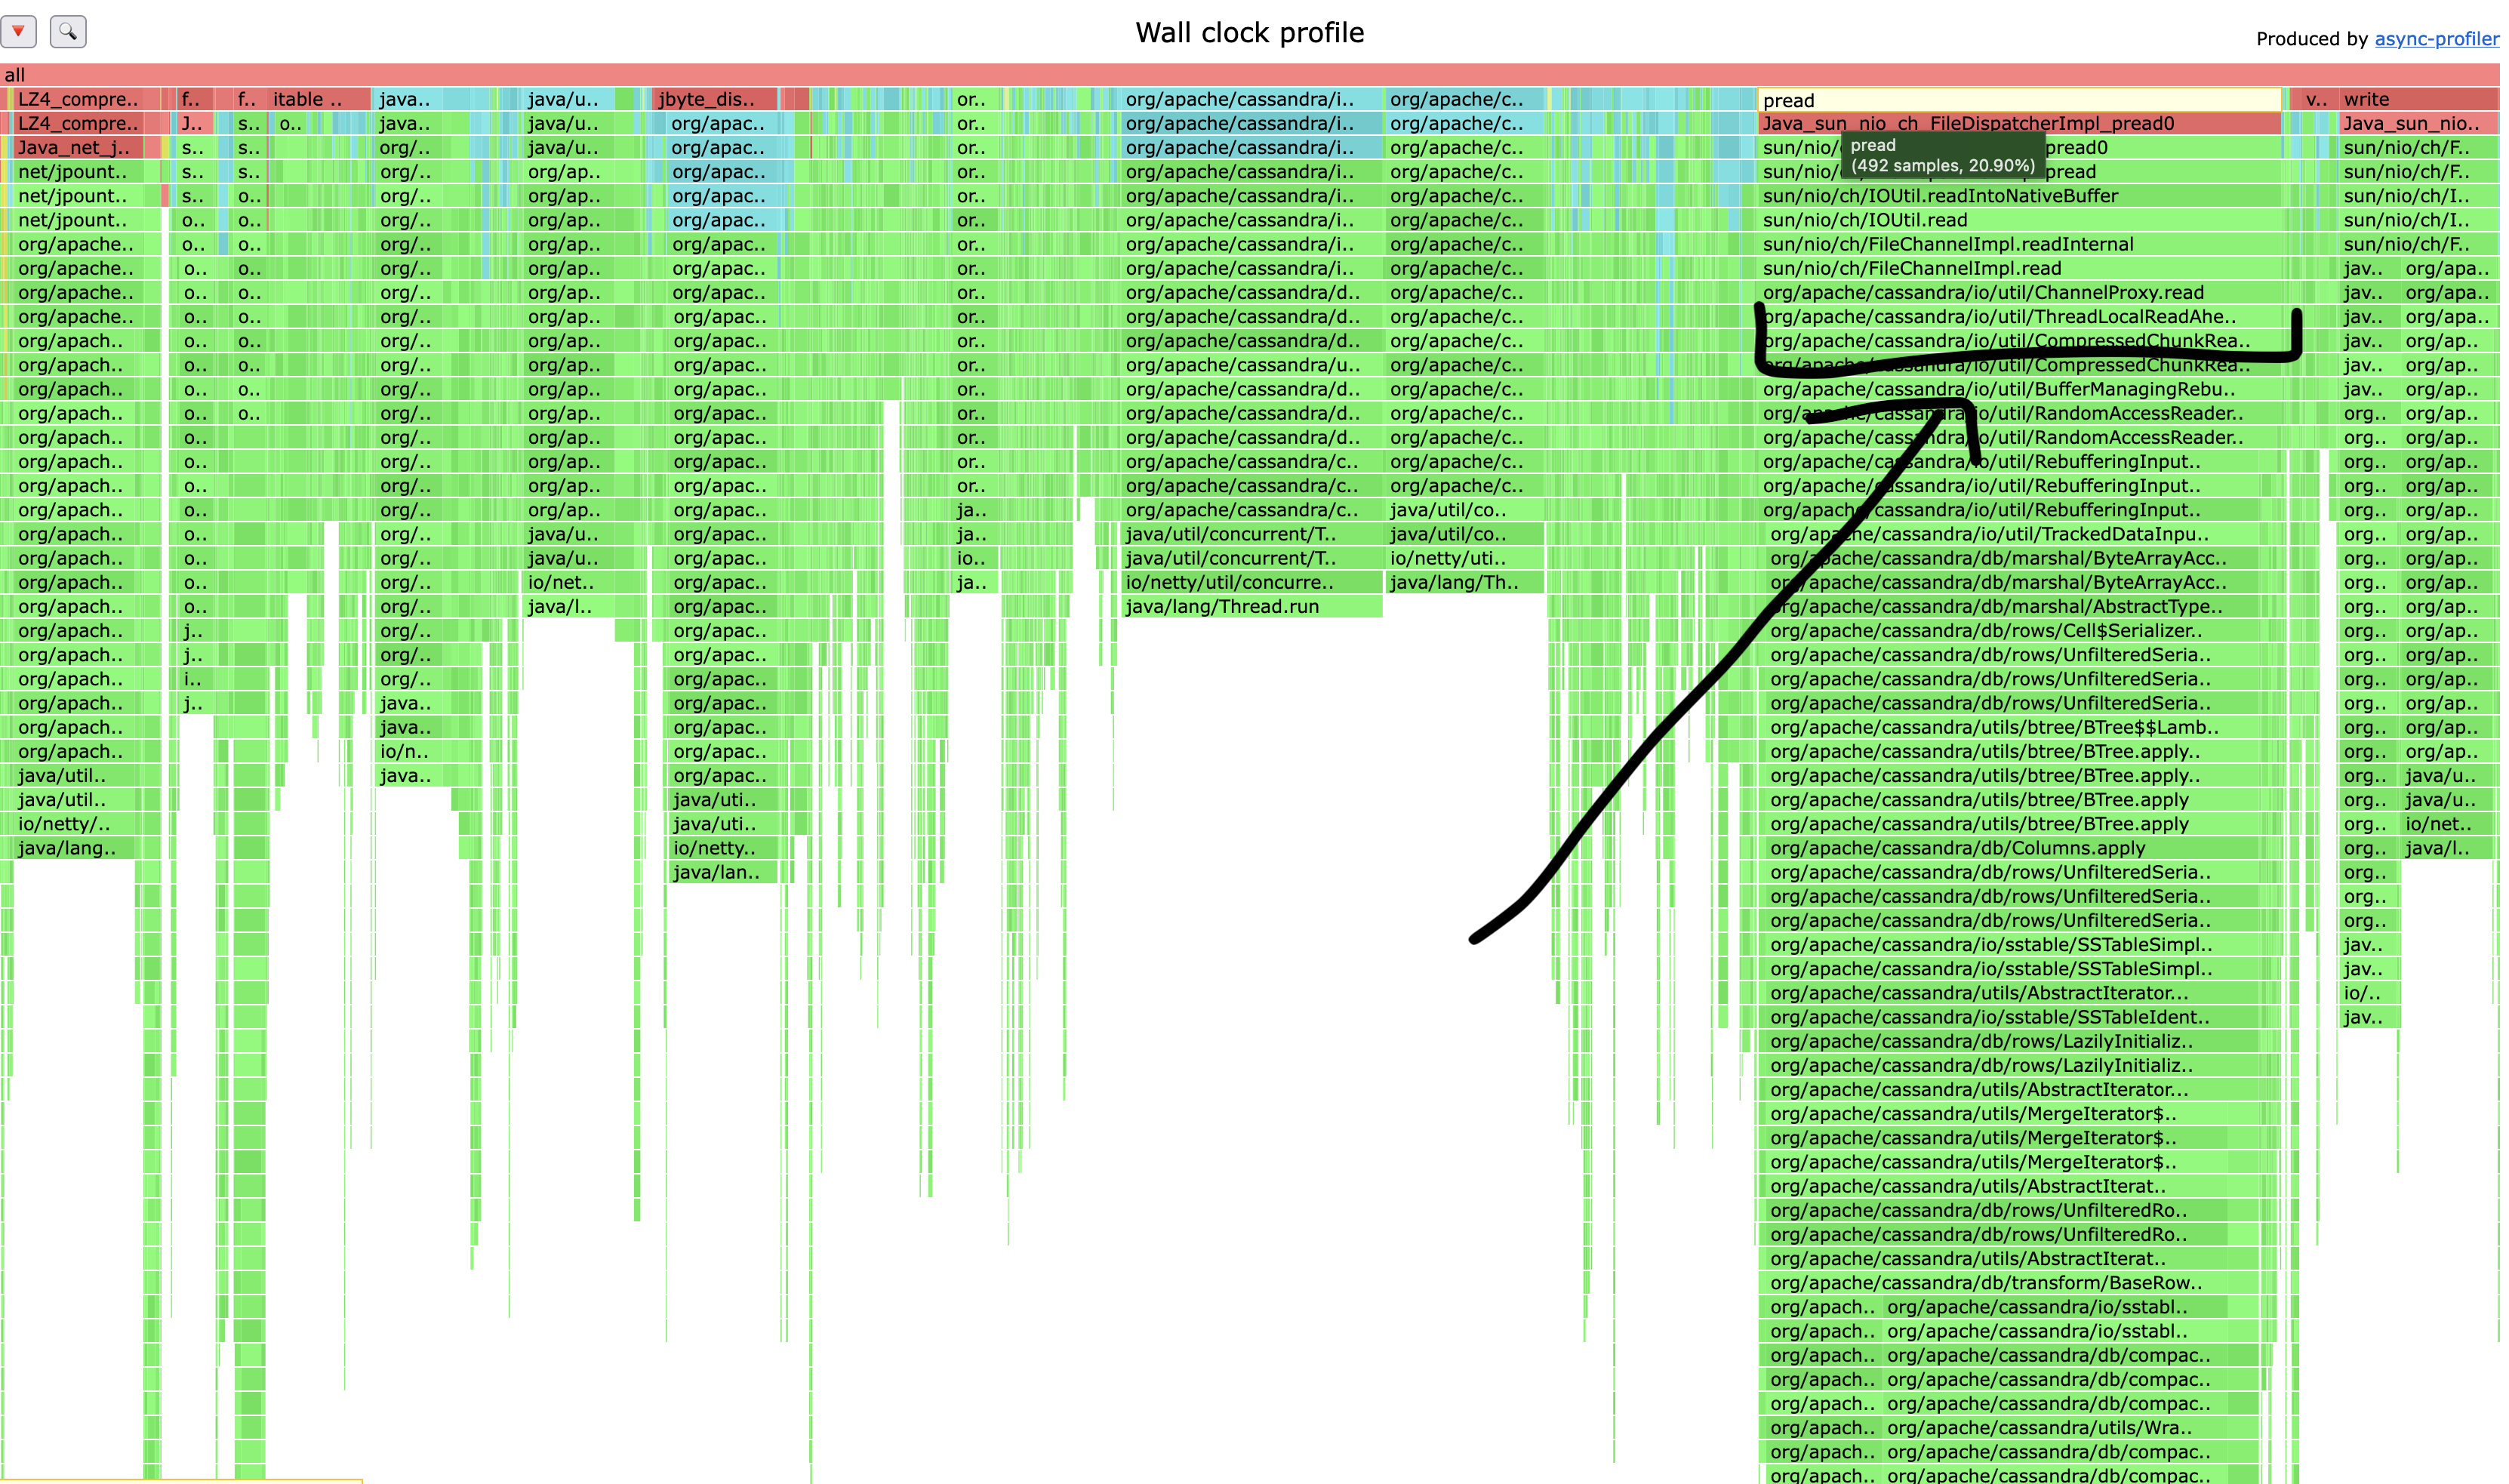
Looking at a wall clock performance profile, we can see compaction is spending a LOT of time waiting on disk, in the really wide column with the pread call at the top:

What About ReadAhead?
Readahead is a disk optimization strategy where the operating system reads a larger block of data than was requested into memory. The objective is reduce latency and improve performance for sequential read operations. Unfortunately, when you don’t need the data it’s reading, it can be the source of major performance problems. In my experience, read ahead is one of the worst culprits in the world of Cassandra performance. It’s especially terrible for lightweight transactions and counters, where we perform a read before write.
My advice to Cassandra operators is to reduce readahead to 4KB to avoid unnecessary read amplification on the read path.
Readahead does have one place, however, where it can benefit performance. You may have already guessed that it’s compaction. Let’s take a step back and look at how the size of our reads impacts our throughput in a simple benchmark. Larger reads, initiated either from read ahead or the user, should deliver improved throughput, especially when we’re dealing with a quota on our IOPS (EBS), our drives have higher latency (SAN), or both.
Benchmarking
I ran benchmark tests with sequential fio workloads using different request sizes on a 3K IOPS GP3 EBS volume. Here’s the configuration used:
[global]
rw=read
directory=data
direct=1
time_based=1
file_service_type=normal
stonewall
size=100M
numjobs=12
group_reporting


[bs4]
stonewall
runtime=60s
blocksize=4k

[bs8]
stonewall
runtime=60s
blocksize=8k

[bs16]
stonewall
runtime=60s
blocksize=16k

[bs32]
stonewall
runtime=60s
blocksize=32k

[bs64]
stonewall
runtime=60s
blocksize=64k

[bs128]
stonewall
blocksize=128k
runtime=60s

[bs256]
stonewall
runtime=60s
blocksize=256k
When reviewing the results, the benefits of using larger request sizes were evident:
| Request Size | IOPS | Throughput |
|---|---|---|
| 4K | 3049 | 11.9 MB/s |
| 8K | 3012 | 23 MB/s |
| 16K | 3013 | 47 MB/s |
| 32K | 3013 | 94 MB/s |
| 64K | 1938 | 121 MB/s |
| 128K | 957 | 120 MB/s |
| 256K | 478 | 120 MB/s |
The data shows that using 256KB reads instead of 16KB reads would deliver almost 3x the throughput while using only 1/6th of the provisioned IOPS. That’s a massive efficiency improvement. Rather than chewing through all our IOPS to deliver a paltry 47MB/s of throughput, we’re only using about 500 for 120MB/s. That means if we can see these gains in the database, we’ll be able to compact faster, put more data on each node, and lower our total cost.
The Solution: Internally Buffering Sequential Reads
In CASSANDRA-15452, I worked with my fellow Cassandra committer Jordan West to implement a solution: an efficient, internal read-ahead buffer for bulk reading operations. Here’s how it works:
- Instead of reading tiny chunks, we use a 256KB off-heap buffer
- Each read operation pulls in a full 256KB of data at once
- Compressed chunks are extracted from this buffer as needed
- The buffer is refilled only when necessary
This approach maximizes IOPS efficiency by using larger reads during compaction (as well as repair and range reads) that deliver more data per operation. For cloud environments, it’s a game-changer that directly aligns with storage provider recommendations. AWS EBS, for instance, considers any I/O operation up to 256KB as a single operation, so by using the largest possible size we should get optimal performance.
Real-World Impact: A Major Improvement in Compaction Throughput
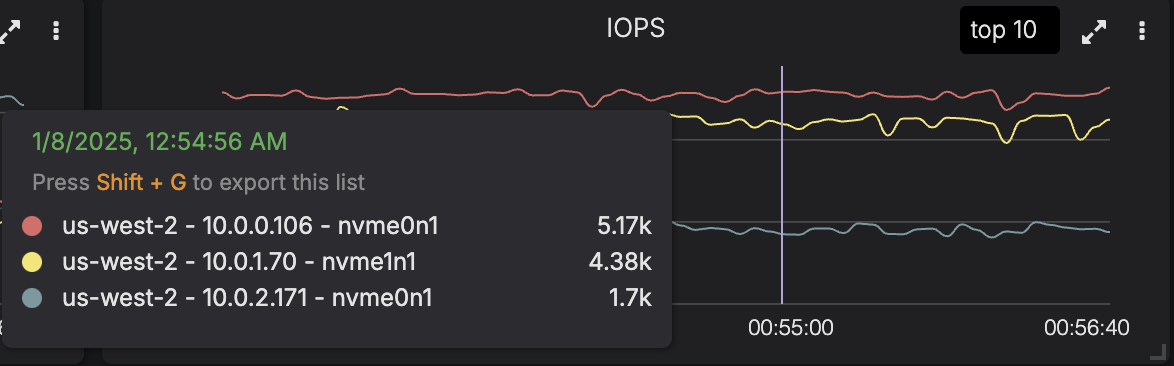
When Jordan and I tested the implementation using easy-cass-lab on EBS, the results were nothing short of spectacular. The 10.0.2.171 node is running our patched version, the other two nodes are running an unpatched release. The graphs clearly show a 2-3x improvement to throughput and a 3x reduction in IOPS.
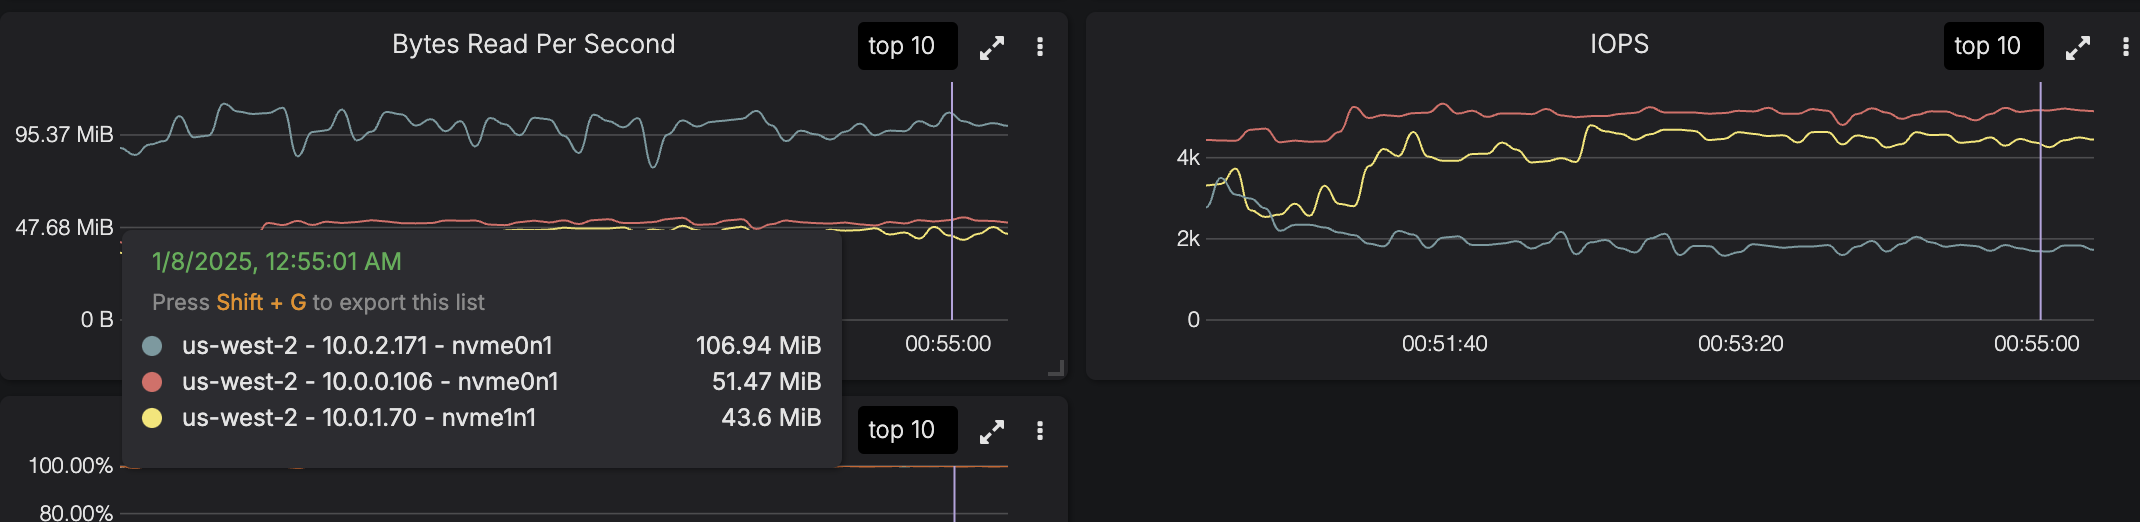
You can see the results in the flamegraph as well. The calls to pread take up significantly less time.
We can use xfsslower from bcc-tools again to watch the filesystem access:
$ sudo /usr/share/bcc/tools/xfsslower 0 -p $(cassandra-pid) | awk '$4 == "R" { print $0 }'
TIME     COMM           PID    T BYTES   OFF_KB   LAT(ms) FILENAME
14:40:29 CompactionExec 1782   R 262144  256         0.07 nb-4-big-Data.db
14:40:29 CompactionExec 1782   R 262144  512         0.06 nb-4-big-Data.db
14:40:29 CompactionExec 1782   R 262144  768         0.06 nb-4-big-Data.db
14:40:29 CompactionExec 1782   R 262144  1024        0.07 nb-4-big-Data.db
14:40:29 CompactionExec 1782   R 262144  1280        0.07 nb-4-big-Data.db
14:40:29 CompactionExec 1782   R 262144  1536        0.07 nb-4-big-Data.db
14:40:29 CompactionExec 1782   R 241123  1792        0.07 nb-4-big-Data.db
This is a lot better, now we’re fetching 256KB at a time using way fewer requests.
The EBS test configuration used a GP3 volume with 3K IOPS and 256MB throughput. With the existing code, compaction was bottlenecked by IOPS, peaking at exactly 3K IOPS but achieving only about 51MB/s throughput. With our optimization, the same operation used only ~500 IOPS to achieve around 106MB/s—a more than 2x improvement in throughput with 1/3IOPS.
In our most aggressive testing, we actually hit the EBS throughput limit rather than the IOPS limit. That’s a significant transformation in Cassandra’s resource utilization profile.
The patch also has the benefit of applying to anti-compaction, repair, and range reads. We can see a significant reduction in range reads, aka table scans:
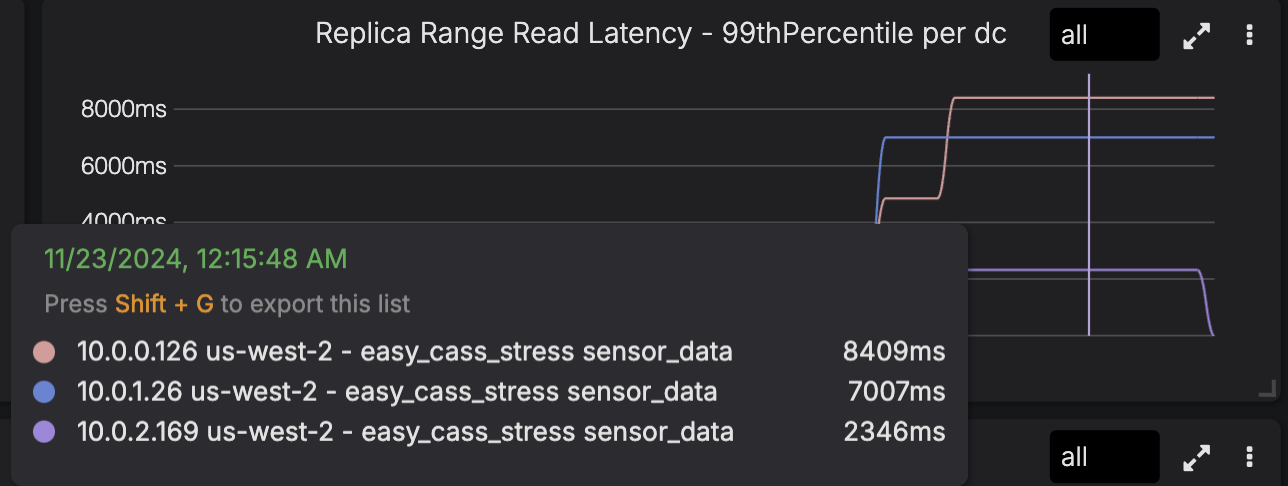
If you’re running Spark jobs using the Cassandra connector, you should see an improvement in performance, and your repair times should decrease.
What’s next? Can we do more?
Yes, absolutely! There’s several more improvements to IO that will help improve things. I’ll cover them here very quickly, and if there’s interest I’ll write about them in detail in a future post.
Avoid Reading the Statistics
When compacting, we read data out of the Statistics.db file before reading the data itself. This is completely unnecessary, as it’s stats about the data we’re about to read. Skipping this can reduce IO even further. Looking at a compaction’s IO activity, I see about 30% of the filesystem access is reading from Statistics.db:
14:40:29 CompactionExec 1782   R 4096    0           0.00 nb-3-big-Statistics.db
14:40:29 CompactionExec 1782   R 701     4           0.00 nb-3-big-Statistics.db
14:40:29 CompactionExec 1782   R 4096    0           0.00 nb-4-big-Statistics.db
14:40:29 CompactionExec 1782   R 4096    4           0.00 nb-4-big-Statistics.db
14:40:29 CompactionExec 1782   R 1962    8           0.00 nb-4-big-Statistics.db
14:40:29 CompactionExec 1782   R 262144  0           0.07 nb-4-big-Data.db
14:40:29 CompactionExec 1782   R 2115    0           0.01 nb-3-big-Data.db
14:40:29 CompactionExec 1782   R 262144  256         0.07 nb-4-big-Data.db
14:40:29 CompactionExec 1782   R 262144  512         0.06 nb-4-big-Data.db
14:40:29 CompactionExec 1782   R 262144  768         0.06 nb-4-big-Data.db
14:40:29 CompactionExec 1782   R 262144  1024        0.07 nb-4-big-Data.db
14:40:29 CompactionExec 1782   R 262144  1280        0.07 nb-4-big-Data.db
14:40:29 CompactionExec 1782   R 262144  1536        0.07 nb-4-big-Data.db
14:40:29 CompactionExec 1782   R 241123  1792        0.07 nb-4-big-Data.db
This has already been fixed in trunk by Branimir Lambov in CASSANDRA-20092 and is being backported to 5.0 by Jordan.
Direct I/O for Compaction
Let’s talk more about page cache. Since we go through the Linux page cache when doing reads, we want to make sure it’s working optimally. Page cache lets us avoid going to disk! Unfortunately we also use it when reading for compaction. This is a problem because we’re pulling data into the page cache that we plan on deleting. To make room for the new data, other data will be evicted. If we compact 10GB of data, we’re pushing out a lot of valuable data from the page cache, meaning it needs to be fetched back into memory later on. Using Direct I/O we can bypass the page cache entirely, which will prevent data from being evicted. This can be a huge help in latency sensitive systems or systems where IOPS are limited like EBS.
I’ve filed CASSANDRA-19987 to look at this.
Non Blocking Compression
Next, compression. When we’re writing to disk, we fill a buffer, sized by the chunk_length_in_kb table setting, compress, and write to disk. The compression here is a blocking call, which means we can spend a lot of time waiting on compression to finish, when we could be reading and merging the next chunk in parallel This can show up as a performance bottleneck, so I’ve filed CASSANDRA-20085 to look into it.
Better Memory Management
When a system is not bottlenecked on disk I/O, such as when using NVMe, the main issue we’ll run into is our heap allocation rate. I’ll go into details in a future post, but for now, it’s enough to know that the more memory we allocate, the worse our performance. Being smart about memory allocations can make a big difference in overall time spent, as allocations aren’t free. It also reduces both the frequency and duration of Garbage Collection. Big wins all around.
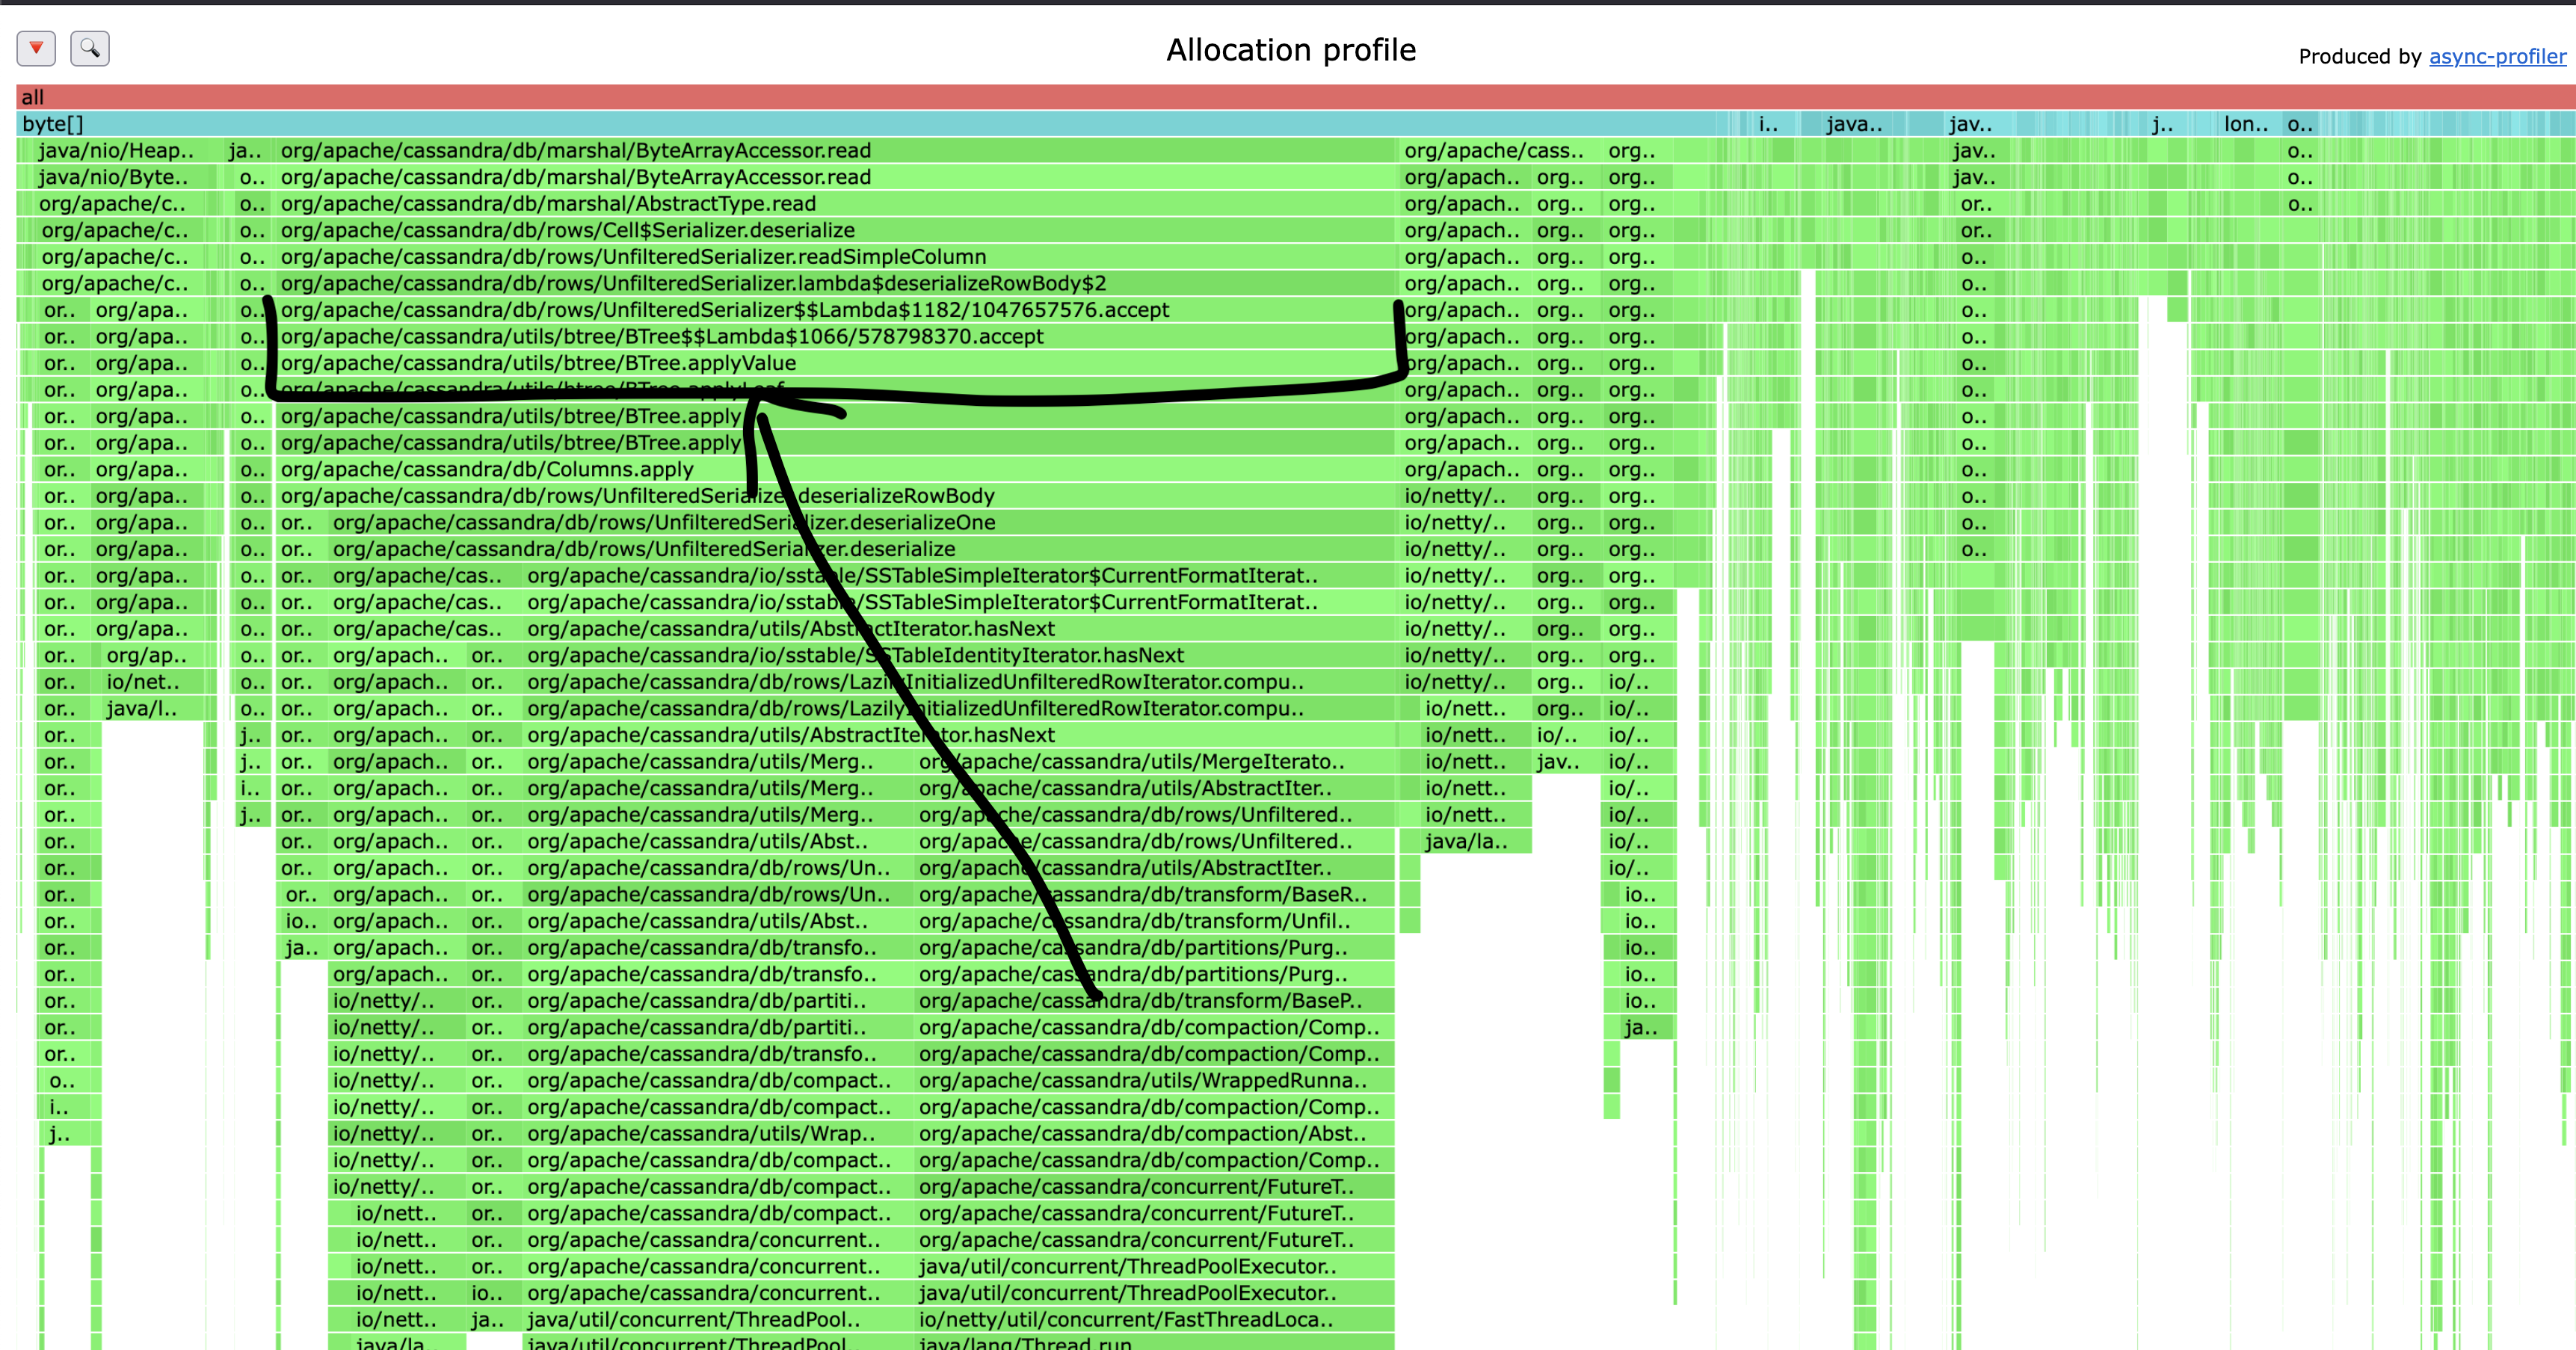
I recently profiled an instance where the row size was about 2KB (not out of the ordinary) and found that a single call was accounting for roughly 50% of memory allocated. Fixing this one thing has the potential to deliver a massive performance improvement, especially in workloads where we have either lots of fields, or large fields like serialized blobs.
Reaching again for async-profiler, this time we run it with -e alloc to track allocations and --reverse to reverse the stacks. I do this because the same underlying call comes from the read path and compaction, and I want to see the time in aggregate.
Addressing this single allocation won’t just deliver faster compaction, but will reduce pressure on the heap, which in turn reduces GC overhead. As part of this series I’ll also be covering GC, as a lot’s changed since I wrote about it last.
I’ve filed CASSANDRA-20428 and there’s already a fair bit of discussion about different approaches to solving the problem.
Conclusion
Maximizing compaction throughput is critical for achieving higher node density with Apache Cassandra. The improvements in CASSANDRA-15452 have removed one of the primary bottlenecks that previously limited practical node size in a lot of clusters.
By upgrading to Cassandra 5.0.4 (or later) you can:
- Dramatically improve compaction throughput
- Reduce IOPS consumption significantly
- Improve overall system stability during write-heavy workloads
- Increase the maximum practical data density per node
- Significantly reduce your cloud storage costs
This improvement, combined with the streaming optimizations discussed in the previous post, creates a multiplier effect on your ability to increase node density. Each optimization removes a bottleneck, allowing you to push your hardware further and achieve more with less.
In my next post, I’ll be discussing how and why compaction strategies affect node density. Picking the right strategy can have a significant impact on your cluster’s performance and cost efficiency. Make sure you sign up for my mailing list if you’re interested in getting notified when it’s released!
If you found this post helpful, please consider sharing to your network. I'm also available to help you be successful with your distributed systems! Please reach out if you're interested in working with me, and I'll be happy to schedule a free one-hour consultation.